Liberals would win 200+ seats if election held today
The Writ's federal vote and seat projections are now live!

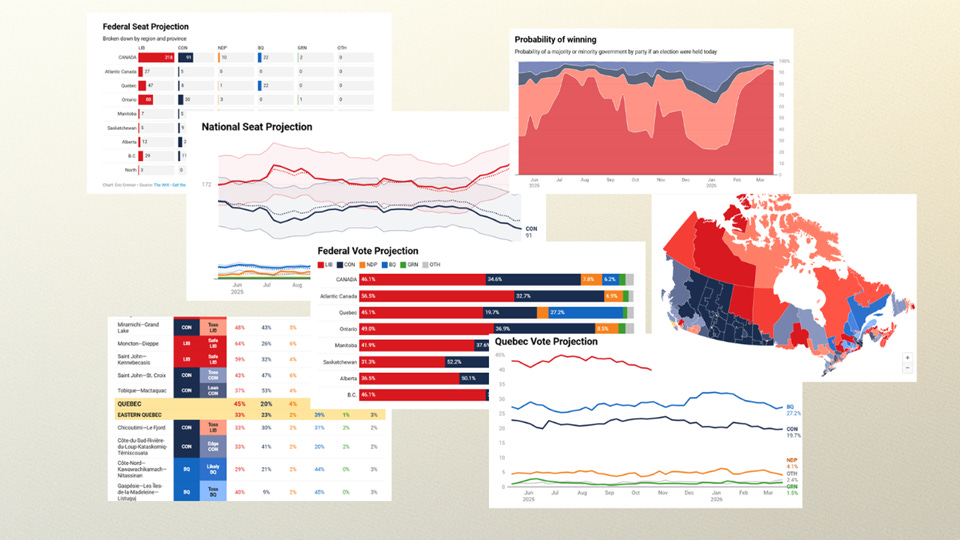
Just a few days out from the first anniversary of the start of the 2025 election campaign, Mark Carney’s Liberals would likely win well over 200 seats if another election were held today.
That’s what The Writ’s new model shows in its inaugural projection. Yes, the vote and seat projection model is finally live!

I’ve been working away at a new model since the last election and, after a flurry of activity over the last few weeks, it is now finally ready to present. A methodological explanation can be found here, if you want to dive into the details. The full national and regional projections can be found here, and full riding projections can be found here.
These will all be best viewed on the website, as the charts are interactive. But let’s take a brief look at some of the topline numbers as this projection is launched.
The Liberals are projected to be leading in 218 seats across the country, a significant increase of 49 seats from the last election. That puts them well over the threshold of 172 seats required for a majority government, hardly a surprise when they are projected to take 46.1% of the vote. The party’s odds of winning a majority if an election where held today are 92%. Their odds of a majority are 95%.
If things are going well for the Liberals, it’s because things are going badly for the Conservatives. They’re down to 34.6% of the vote and just 91 seats, a fall of 53 seats since the last election. The Bloc Québécois is holding at 22 seats, while the New Democrats might be able to take enough advantage of the Conservatives’ weakness to jump to 10 seats with 7.8% of the vote. The Greens, at 2.3%, have a shot at two seats.
Below you’ll see the Vote and Seat Projection table that you’ll find at the top of the Vote and Seat Projections page. Let me take you through how to read it.
In the first column is the Vote Projection. As it is reflects the sum total of all of the riding-level projections in the model, it isn’t a simple polling average (though that is where things start). It’s the best guess at what the result would be in a snap election based on where the polls are today and adjusted for any important dynamics in the 343 ridings across the country.
The next three columns show the Seat Projection with the high and low ranges. The Seat Projection is the number of seats in which each party is projected to be leading, based on the polls and any local riding dynamics (such as the presence or lack thereof of an incumbent or a floor-crosser, to name a few of the factors the model takes into account). The low and high ranges show 95% of all likely outcomes, taking into account potential polling and modelling error. You’ll notice that there is a much bigger gap between the Conservative projection and their high range vs. their low range, and vice versa for the New Democrats. This is not an accident, as the ranges take into account how parties perform in actual elections relative to their polls.
The final column on the right shows the Avg. Projection, which is the result of 10,000 simulations. Like the ranges, this takes into account potential polling and modelling error. The Conservatives often beat their polls; the New Democrats don’t. Accordingly, the Avg. Projection for the Conservatives is 106.6 seats rather than 91, because they are more likely than not to beat their polls and win more of the toss-ups than expected. The NDP Avg. Projection is 6.8 seats, as they are more likely than not to come up short in a few of the races in which they are projected to lead.
How should you read these numbers? The Seat Projection is The Writ’s “official call”, as it shows what the result of an election would be based on where the polls are today — it doesn’t assume the polls and the modelling will be wrong in one direction or another, as they aren’t always wrong in the same direction from one election to the next. But the Avg. Projection should also be taken into consideration, as it gives an indication of where to set expectations. If tomorrow was election day, the New Democrats should win 10 seats with where the polls are. But don’t be surprised if they would win closer to seven.
My plan is to update the model once per week, usually on Tuesdays, with short posts published to go over the changes in the update. But I might post updates more frequently if the need arises. The model would be updated daily during a campaign.
There’s so much more to dig into, as you’ll see if you head over to the website. Tracking data going back to the last election, riding-by-riding projections and full regional breakdowns. Subscribers to The Writ will have more to explore on their own, but let me take you through some of the highlights.
Already a subscriber to The Writ? You can skip ahead to some more charts and analysis below. But if you’re not a subscriber, here’s a little sneak peak of what is behind the curtain at The Writ’s new vote and seat projections: Charts!