

How the riding-level surprises tell one tale of the election
Where the seat projection missed gives us clues about what happened in the federal vote.

“All else being equal” is a phrase I’ll often repeat when explaining seat projections. They provide a baseline for setting expectations and, in the vast majority of individual cases, all else is indeed equal and things evolve about as expected.
But when they don’t, there are two things that are at play — either the polls were off or something happened at the local or regional level to make a particular riding buck the broader trends.
There were elements of both in the 2025 federal election, but it’s the latter that perhaps played a bigger role in the Liberals falling short of their majority expectations.
Before diving more deeply into the results of the election — Elections Canada has yet to complete the validation of the results in all 343 ridings, though that process is close to completed — I want to take one last look at how those results differed from the expectations. Last week, I looked at how the polls performed. Today, we’re going to delve into the seat projection.
While this is partly an accountability exercise, I also firmly believe that we learn a lot about an election by looking at which ridings and regions of the country are missed by seat projection models. In some elections, the polls are too wildly off or the models are too wildly off to learn much of anything, but that wasn’t the case this time. The polls did a good job, as did seat projection models — like mine, which powered the CBC’s Poll Tracker.
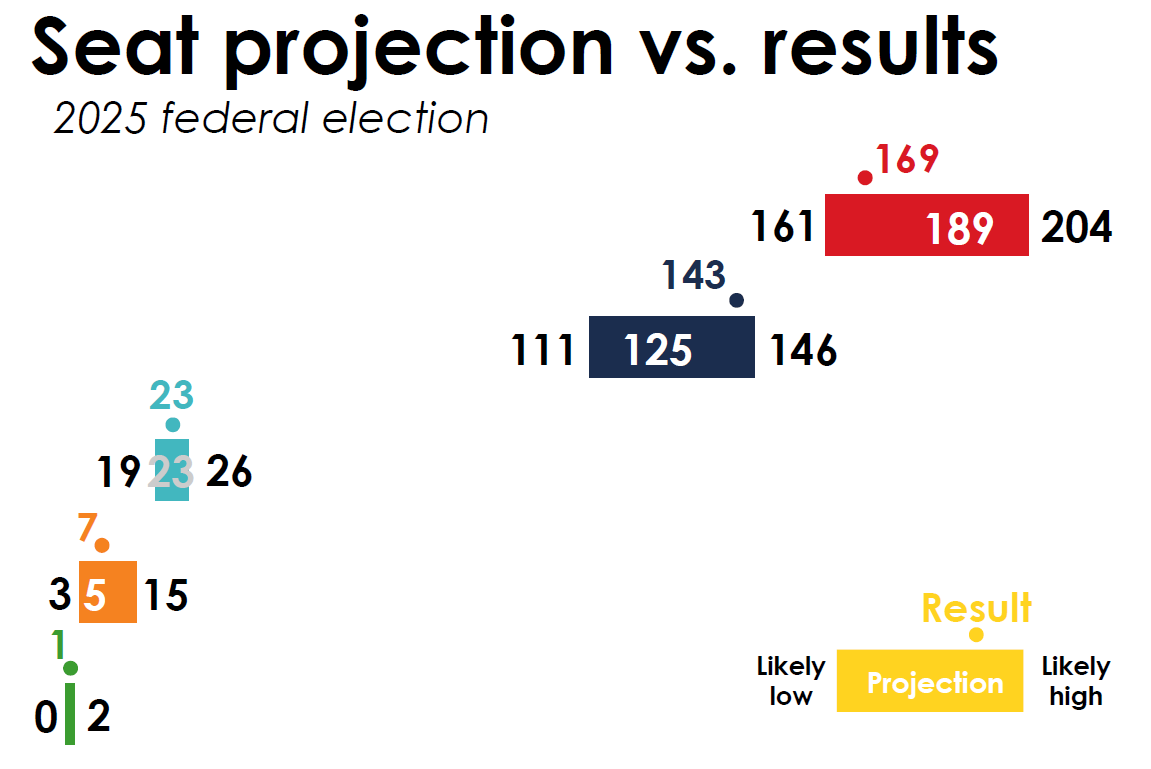
The results finished within the likely ranges of the model. The Liberals had a floor of 161 seats and won 169. The Conservatives had a ceiling of 146 and won 143. Those results neared the edges of the expected ranges, but they were nevertheless within those ranges. The Bloc won 23 seats, as projected, and the NDP won seven instead of the projected five.
If we consider the model correct when it projected a riding to be a “toss” and that riding was won by one of the parties considered in contention, then the model made the correct call in 323 of 343 ridings (94.2%). The model did, however, also make calls for those tosses, even if I didn’t publicize them. If we take those into account, then the model got 298 of 343 correct (86.9%).
Much of it came down to those tosses — and half of all missed calls came in Ontario, despite the province containing just under 36% of all seats.
But the model was well-calibrated in its calls, as shown by the chart below. “Safe” ridings went to the projected winner 99.3% of the time (only one “safe” seat was called wrongly), while the “likely” calls were correct 92.2% of the time. Leaning calls were correct 75% of the time and tosses were, of course, a toss-up. (The accuracy is less than 50% in the toss-ups because a few ridings were deemed to be three-way races.)

This shows that the classification system used by the model worked well. Knowing this, we can now look at how each of the parties did in these ridings — did they disproportionately win or lose in ridings that were deemed to be close?
The Liberals only slightly under-performed in safe, likely and leaning ridings. But they significantly under-performed in toss-ups, winning only one-third of them.
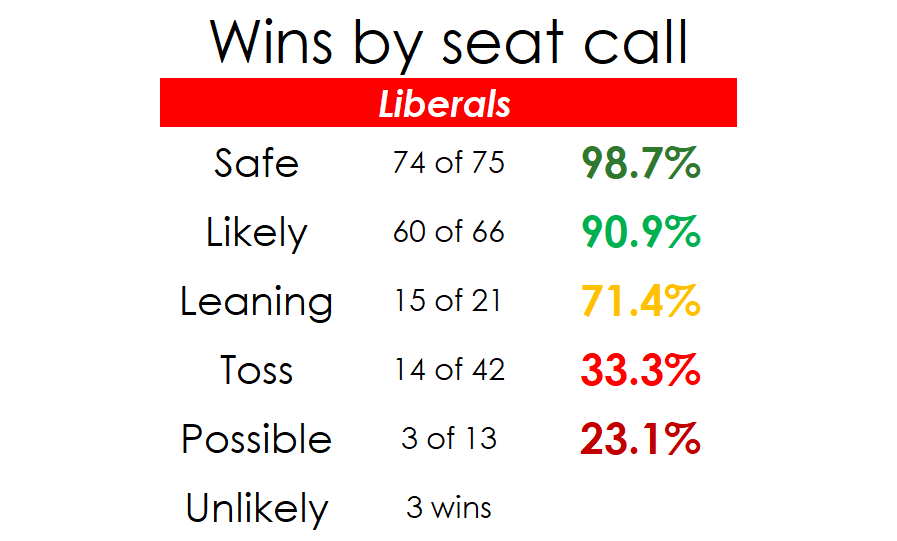
Had the Liberals performed just a little better in the ridings that were expected to be the closest, they would have won their majority government. Their disproportionately bad record in the toss-ups is the reason that the Liberals under-performed the projection of 189 seats. Again, this was mostly in Ontario — for instance, the Liberals won most of their tosses in Quebec but lost most of their tosses in Ontario.
The Conservatives were the biggest beneficiary of this. They did about as well as the Liberals did in safe, likely and leaning ridings, but were twice as successful in tosses, winning two-thirds of them. They were also slightly more successful in “possible” wins, while they added seven victories to their tally in ridings that were deemed likely or safe wins for another party.
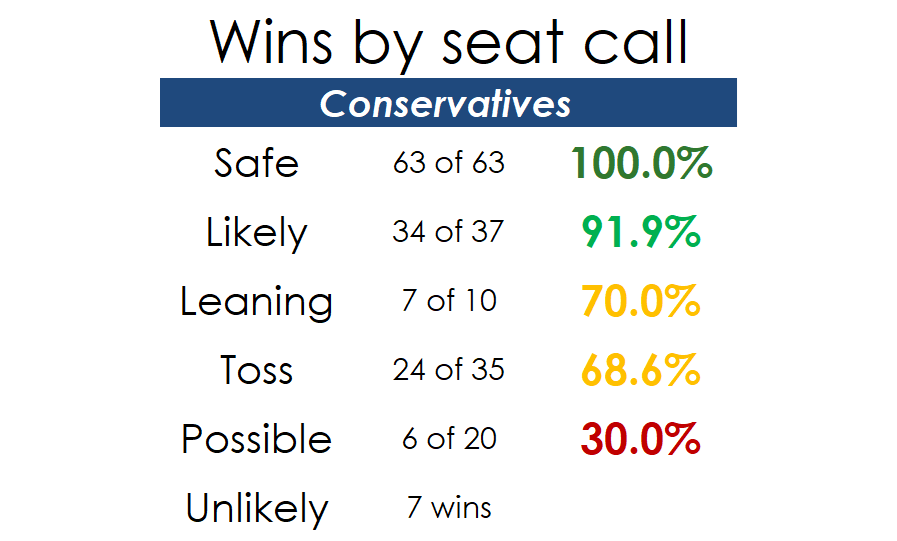
Again, this was regionally localized. The Conservatives lost both of their tosses in Quebec, but won 11 of 16 in Ontario and even won five of 13 possibles in that province. Alberta was another success story for the Conservatives as they won seven of eight tosses. The Conservatives out-performed expectations in close races and, in so doing, kept the Liberals to a minority.
The other two parties did about as well as expected — unsurprisingly, considering their projected seat haul was close to the mark. The Bloc Québécois did well in likely and leaning seats (none were projected to be “safe”), but won just over half of their tosses and none of their possibles.

The New Democrats scraped by thanks to sweeping their leaning ridings and winning one-third of their tosses. But the NDP had a ceiling of as many as 15 seats and did not approach the 12-seat threshold needed for recognized party status because of all their lost tosses.

British Columbia was relatively lucky for the New Democrats, however, as three of their four toss victories occurred in that province.
This high level look at the numbers makes a simple case for what happened in this election. While the Bloc and NDP performed about as expected, the Liberals lost too many close races to the Conservatives to secure their majority.
But now let’s delve into the riding-level results that tell the real story about what happened.